Catalogue Search | MBRL


Are you sure you want to remove the book from the shelf?

{{itemTitle}}
42
result(s) for
"STATSnetBASE"
Sort by:

Applied Regression and ANOVA Using SAS
Applied Regression and ANOVA Using SAS® has been written specifically for non-statisticians and applied statisticians who are primarily interested in what their data are revealing. Interpretation of results are key throughout this intermediate-level applied statistics book. The authors introduce each method by discussing its characteristic features, reasons for its use, and its underlying assumptions. They then guide readers in applying each method by suggesting a step-by-step approach while providing annotated SAS programs to implement these steps.
Those unfamiliar with SAS software will find this book helpful as SAS programming basics are covered in the first chapter. Subsequent chapters give programming details on a need-to-know basis. Experienced as well as entry-level SAS users will find the book useful in applying linear regression and ANOVA methods, as explanations of SAS statements and options chosen for specific methods are provided.
Features:
Statistical concepts presented in words without matrix algebra and calculus
Numerous SAS programs, including examples which require minimum programming effort to produce high resolution publication-ready graphics
Practical advice on interpreting results in light of relatively recent views on threshold p-values, multiple testing, simultaneous confidence intervals, confounding adjustment, bootstrapping, and predictor variable selection
Suggestions of alternative approaches when a method's ideal inference conditions are unreasonable for one's data
This book is invaluable for non-statisticians and applied statisticians who analyze and interpret real-world data. It could be used in a graduate level course for non-statistical disciplines as well as in an applied undergraduate course in statistics or biostatistics.
eBook
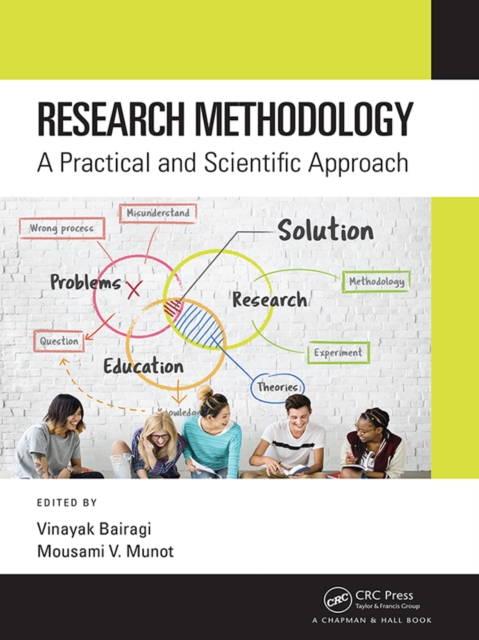
Research Methodology
This book offers a design research methodology intended to improve the quality of design research- its academic credibility, industrial significance and societal contribution by enabling more thorough, efficient and effective procedures.
1. Introduction to Research
[Geetanjali V. Kale and J. Jayanth]
2. Literature Survey and Problem Statement
[Dr. Manoj S. Nagmode]
3. Research Design
[Prachi Joshi]
4. Basic Instrumentation
[Pradeep B. Mane and Shobha S. Nikam]
5. Applied Statistics
[Varsha K. Harpale and Vinayak K. Bairagi]
6. Presenting and Publishing the Research Findings
[Krishna Warhade, Vinayak K. Bairagi, and J. Jayanth]
7. Plagiarism
[Mousami V. Munot, Sesha S. Srinivasan, and Anand S. Bhosle]
8. Intellectual Property Rights
[Dipali Kasat, Rajeev Kumar, and Shailaja Patil]
Dr. Vinayak Bairagi has completed M.E. (Electronic) from Sinhgad COE, Pune in 2007 (1st Rank in Pune University). University of Pune has awarded him a PhD degree in Engineering. He has teaching experience of 12 years and research experience of 8 years. He has filed 10 patents and 5 copyrights in technical field. He has published more than 58 papers, of which 26 papers are in International journals of which 12 papers in SCI Indexed journals, with five Springer journal publications along with One in The_IET journal publication. He is a reviewer for nine scientific journals including IEEE Transactions, The-IET Journal, and Springer Journals. He is the P.I. for UoP-BUCD research grant. He has received “Maniratna” Best Teacher Award for Excellent academic Performance (2013). He has received IEI national level Young Engineer Award (2014) and ISTE national level Young Researcher Award (2015) for his excellence in the field of engineering. He is the member of INENG (UK), IETE (India), ISTE (India) &BMS (India). He had worked on Image compression at College of Engineering, Pune, under Pune University. Currently he is associated with AISSMS Institute of Information Technology (Affiliated college to S P Pune University), Pune as Professor in Electronics and Telecommunication Engineering. He is recognized PhD Guide in Electronics engineering of SavitribaiPhule Pune University. Presently he is guiding 7 PhD Students.
Dr. Mousami Vaibhav Munot is currently an Associate Professor in Electronics and Telecommunication Department at Pune Institute of Computer Technology, PICT, Pune, India. She has 13 years of teaching experience and 7 years of research experience. She has completed M.Tech (1st rank holder) from College of Engineering, Pune, CoEP, in 2007. Savitribai Phule Pune University, SPPU has awarded her a PhD degree in November 2013. She has received fellowship from Indian National Academy of Engineering (INAE) for research work under Dr. Jayant Mukhopadhyay, Dept. of Computer Sciences, IIT, Kharagpur, India. She has also received support from DST (ITS) to present a research paper at IET –Image Processing Conference, London, UK. She has received Best paper award at National Conference and international conference. She has fetched grants worth 20 Lakhs from DST, AICTE and SPPU-BCUD for various projects. She has served as Session Chair, IEEE-WIECON, AISSMS, Pune, India, 2016; a TPC member, ICDECT -2016 , Lavasa City , Pune-India, 2016 ; Session chair, EEECoS- 2016 , AISSMS, Pune ,India, 2016 and a Guest Editor for special issue on Soft Computing, Journal of Electrical and Electronics Engineering, Jan 2015. She is reviewer for various reputed journals; IEEE, System, Man and Cybernetics, Springer Medical and Biological Engineering Computing, Springer Journal of Medical Sciences, Canadian Journal of Electrical and Computer Engineering, IET –Image Processing. She is a member of IET, ISTE, BMESI and IoE. She has served IET as younger member section chair, South Asia regional board member, Global operations chair. She has represented India at London, Malyasia and Srilanka for IET Volunteers’ conference and strategy planning conferences and Asia Pacific Young engineers meet.
eBook

Geospatial Health Data
Geospatial health data are essential to inform public health and policy. These data can be used to quantify disease burden, understand geographic and temporal patterns, identify risk factors, and measure inequalities. Geospatial Health Data: Modeling and Visualization with R-INLA and Shiny describes spatial and spatio-temporal statistical methods and visualization techniques to analyze georeferenced health data in R. The book covers the following topics:
Manipulating and transforming point, areal, and raster data,
Bayesian hierarchical models for disease mapping using areal and geostatistical data,
Fitting and interpreting spatial and spatio-temporal models with the integrated nested Laplace approximation (INLA) and the stochastic partial differential equation (SPDE) approaches,
Creating interactive and static visualizations such as disease maps and time plots,
Reproducible R Markdown reports, interactive dashboards, and Shiny web applications that facilitate the communication of insights to collaborators and policymakers.
The book features fully reproducible examples of several disease and environmental applications using real-world data such as malaria in The Gambia, cancer in Scotland and USA, and air pollution in Spain. Examples in the book focus on health applications, but the approaches covered are also applicable to other fields that use georeferenced data including epidemiology, ecology, demography or criminology. The book provides clear descriptions of the R code for data importing, manipulation, modelling, and visualization, as well as the interpretation of the results. This ensures contents are fully reproducible and accessible for students, researchers and practitioners.
I Geospatial health data and INLA
1. Geospatial health Geospatial health data Disease mapping Communication of results
2. Spatial data and R packages for mapping Types of spatial data Areal data Geostatistical data Point patterns Coordinate Reference Systems (CRS) Geographic coordinate systems Projected coordinate systems Setting Coordinate Reference Systems in R Shapefiles Making maps with R ggplot2 leaflet mapview tmap
3. Bayesian inference and INLA Bayesian inference Integrated Nested Laplace Approximations (INLA)
4. The R-INLA package Linear predictor The inla() function Priors specification Example Data Model Results Control variables to compute approximations
II Modeling and visualization
5. Areal data Spatial neighborhood matrices Standardized Incidence Ratio (SIR) Spatial small area disease risk estimation Spatial modeling of lung cancer in Pennsylvania Spatio-temporal small area disease risk estimation Issues with areal data
6. Spatial modeling of areal data. Lip cancer in Scotland Data and map Data preparation Adding data to map Mapping SIRs Modeling Model Neighborhood matrix Inference using INLA Results Mapping relative risks Exceedance probabilities
7. Spatio-temporal modeling of areal data. Lung cancer in Ohio Data and map Data preparation Observed cases Expected cases SIRs Adding data to map Mapping SIRs Time plots of SIRs Modeling Model Neighborhood matrix Inference using INLA Mapping relative risks 8. Geostatistical data Gaussian random fields Stochastic Partial Differential Equation approach (SPDE) Spatial modeling of rainfall in Paraná, Brazil Model Mesh construction Building the SPDE model on the mesh Index set Projection matrix Prediction data Stack with data for estimation and prediction Model formula inla() call Results Projecting the spatial field Disease mapping with geostatistical data
9. Spatial modeling of geostatistical data. Malaria in The Gambia Data Data preparation Prevalence Transforming coordinates Mapping prevalence Environmental covariates Modeling Model Mesh construction Building the SPDE model on the mesh Index set Projection matrix Prediction data Stack with data for estimation and prediction Model formula inla() call Mapping malaria prevalence Mapping exceedance probabilities
10. Spatio-temporal modeling of geostatistical data. Air pollution in Spain Map Data Modeling Model Mesh construction Building the SPDE model on the mesh Index set Projection matrix Prediction data Stack with data for estimation and prediction Model formula inla() call Results Mapping air pollution predictions
III Communication of results
11. Introduction to R Markdown R Markdown YAML Markdown syntax R code chunks Figures Tables Example
12. Building a dashboard to visualize spatial data with flexdashboard The R package flexdashboard R Markdown Layout Dashboard components A dashboard to visualize global air pollution Data Table using DT Map using leaflet Histogram using ggplot2 R Markdown structure. YAML header and layout R code to obtain the data and create the visualizations
13. Introduction to Shiny Examples of Shiny apps Structure of a Shiny app Inputs Outputs Inputs, outputs and reactivity Examples of Shiny apps Example 1 Example 2 HTML Content Layouts Sharing Shiny apps
14. Interactive dashboards with flexdashboard and Shiny An interactive dashboard to visualize global air pollution
15. Building a Shiny app to upload and visualize spatio-temporal data Shiny Setup Structure of app.R Layout HTML content Read data Adding outputs Table using DT Time plot using dygraphs Map using leaflet Adding reactivity Reactivity in dygraphs Reactivity in leaflet Uploading data Inputs in ui to upload a CSV file and a shapefile Uploading CSV file in server() Uploading shapefile in server() Accessing the data and the map Handling missing inputs Requiring input files to be available using req() Checking data are uploaded before creating the map Conclusion
16. Disease surveillance with SpatialEpiApp Installation Use of SpatialEpiApp ‘Inputs’ page ‘Analysis’ page ‘Help’ page
Appendix
A R installation and packages used in the book A.1 Installing R and RStudio A.2 Installing R packages A.3 Packages used in the book
\" The stress is on practical usage of INLA modelling in a spatial context and hence the author shows the full code for several carefully selected examples. Essentially all the steps from the beginning (necessary data manipulation and preparation) via INLA analysis itself (often in several alternatives) to the results (plots and maps) are explained carefully and commented. This is very useful for anybody who wants to start with the powerful INLA but did not dare to go through the very powerful but notalways- fully-documented environment.\" ~Marek Brabec, ISCB News
Paula Moraga is a Lecturer in the Department of Mathematical Sciences at the University of Bath. She received her Master’s in Biostatistics from Harvard University and her Ph.D. in Statistics from the University of Valencia. Dr. Moraga develops innovative statistical methods and open-source software for disease surveillance including R packages for spatio-temporal modeling, detection of clusters, and travel-related spread of disease. Her work has directly informed strategic policy in reducing the burden of diseases such as malaria and cancer in several countries.
eBook
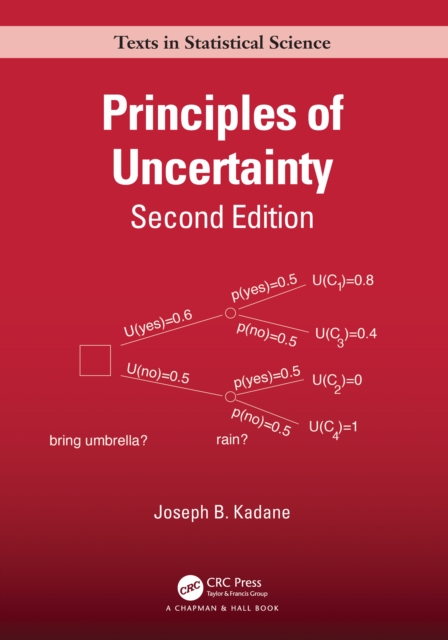
Principles of Uncertainty
Praise for the first edition:
Principles of Uncertainty is a profound and mesmerising book on the foundations and principles of subjectivist or behaviouristic Bayesian analysis... the book is a pleasure to read. And highly recommended for teaching as it can be used at many different levels... A must-read for sure!
- Christian Robert, CHANCE
It's a lovely book, one that I hope will be widely adopted as a course textbook.
- Michael Jordan, University of California, Berkeley, USA
Like the prize-winning first edition,
Principles of Uncertainty, Second Edition
is an accessible, comprehensive text on the theory of Bayesian Statistics written in an appealing, inviting style, and packed with interesting examples. It presents an introduction to the subjective Bayesian approach which has played a pivotal role in game theory, economics, and the recent boom in Markov Chain Monte Carlo methods. This new edition has been updated throughout and features new material on Nonparametric Bayesian Methods, the Dirichlet distribution, a simple proof of the central limit theorem, and new problems.
Key Features:
First edition won the 2011 DeGroot Prize
Well-written introduction to theory of Bayesian statistics
Each of the introductory chapters begins by introducing one new concept or assumption
Uses \"just-in-time mathematics\"-the introduction to mathematical ideas just before they are applied
Like the De Groot winning first edition, the second edition of Principles of Uncertainty is an accessible, comprehensive guide to the theory of Bayesian Statistics written in an appealing, inviting style, and packed with interesting examples.
eBook

Supervised Machine Learning
The artificial intelligence (AI) framework is intended to solve a the problem of bias--variance tradeoff for supervised learning methodsin real-life applications. The AI framework It comprises of bootstrapping to create multiple training and testing datasetsdata sets with various characteristics, design, and analysis of statistical experiments to identify optimal feature subsets and optimal hyper-parameters for machine learning (ML) methods, and data contamination to test for the robustness of the classifiers.
Key Features:
Using ML methods by itself doesn't does notensure building classifiers that generalize well for new data.
Identifying optimal feature subsets and hyper-parameters of ML methods can be resolved using the design and analysis of statistical experiments.
Using a bootstrapping approach to massive sampling of training and tests datasets with various data characteristics (e.g.: contaminated training sets) allows dealing with bias.
Developing of anSAS-based table-driven environment allows managing the management of all meta-data related to the proposed AI framework and creating the creation of interoperability with R libraries to accomplish a variety of statistical and machine-learning tasks.
Computer programs in R and SAS that create AI frameworks are available on GitHub.
eBook
Biometry for Forestry and Environmental Data
Biometry for Forestry and Environmental Data with Examples in R
focuses on statistical methods that are widely applicable in forestry and environmental sciences, but it also includes material that is of wider interest.
Features:
Describes the theory and applications of selected statistical methods and illustrates their use and basic concepts through examples with forestry and environmental data in R.
Rigorous but easily accessible presentation of the linear, nonlinear, generalized linear and multivariate models, and their mixed-effects counterparts. Chapters on tree size, tree taper, measurement errors, and forest experiments are also included.
Necessary statistical theory about random variables, estimation and prediction is included. The wide applicability of the linear prediction theory is emphasized.
The hands-on examples with implementations using R make it easier for non-statisticians to understand the concepts and apply the methods with their own data. Lot of additional material is available at www.biombook.org.
The book is aimed at students and researchers in forestry and environmental studies, but it will also be of interest to statisticians and researchers in other fields as well.
eBook

Handbook of Forensic Statistics
Handbook of Forensic Statistics is a collection of chapters by leading authorities in forensic statistics. Written for statisticians, scientists, and legal professionals having a broad range of statistical expertise, it summarizes and compares basic methods of statistical inference (frequentist, likelihoodist, and Bayesian) for trace and other evidence that links individuals to crimes, the modern history and key controversies in the field, and the psychological and legal aspects of such scientific evidence.
Specific topics include uncertainty in measurements and conclusions; statistically valid statements of weight of evidence or source conclusions; admissibility and presentation of statistical findings; and the state of the art of methods (including problems and pitfalls) for collecting, analyzing, and interpreting data in such areas as forensic biology, chemistry, and pattern and impression evidence. The particular types of evidence that are discussed include DNA, latent fingerprints, firearms and toolmarks, glass, handwriting, shoeprints, and voice exemplars.
eBook

Artificial Intelligence for Drug Development, Precision Medicine, and Healthcare
Artificial Intelligence for Drug Development, Precision Medicine, and Healthcare covers exciting developments at the intersection of computer science and statistics. While much of machine-learning is statistics-based, achievements in deep learning for image and language processing rely on computer science's use of big data. Aimed at those with a statistical background who want to use their strengths in pursuing AI research, the book:
Covers broad AI topics in drug development, precision medicine, and healthcare.
Elaborates on supervised, unsupervised, reinforcement, and evolutionary learning methods.
Introduces the similarity principle and related AI methods for both big and small data problems.
Offers a balance of statistical and algorithm-based approaches to AI.
Provides examples and real-world applications with hands-on R code.
Suggests the path forward for AI in medicine and artificial general intelligence.
As well as covering the history of AI and the innovative ideas, methodologies and software implementation of the field, the book offers a comprehensive review of AI applications in medical sciences. In addition, readers will benefit from hands-on exercises, with included R code.
eBook
R for Health Data Science
HealthyR: R for Health Data Analysis includes everything you need to go from R Novice to R Guru. By the end of this book, you will be taking a sophisticated approach to health data science with beautiful visualisations, elegant tables, and nuanced analyses. You are in safe hands - Ewen is a clinician and Riinu a data scientist, and they bring 25 years combined experience of using R at the coalface. This content has been taught to hundreds of individuals from a variety of backgrounds, from rank beginners, to experts moving to R from another platform. You will learn:
The fundamentals of R
To understand your data with sophisticated plots and tables
The common statistical approaches to health data science
How to create final publishable documents in one-step
How to collaborate across teams and track versions.
eBook

Spatial Analysis with R
In the five years since the publication of the first edition of
Spatial Analysis: Statistics, Visualization, and Computational Methods
, many new developments have taken shape regarding the implementation of new tools and methods for spatial analysis with R. The use and growth of artificial intelligence, machine learning and deep learning algorithms with a spatial perspective, and the interdisciplinary use of spatial analysis are all covered in this second edition along with traditional statistical methods and algorithms to provide a concept-based problem-solving learning approach to mastering practical spatial analysis. Spatial Analysis with R: Statistics, Visualization, and Computational Methods, Second Edition, provides a balance between concepts and practicums of spatial statistics with a comprehensive coverage of the most important approaches to understand spatial data, analyze spatial relationships and patterns, and predict spatial processes.
New in the Second Edition:
Includes new practical exercises and worked out examples using R
Presents a wide range of hands-on spatial analysis work tables and lab exercises
All chapters are revised and include new illustrations of different concepts using data from environmental and social sciences
Expanded material on spatiotemporal methods, visual analytics methods, data science, and computational methods
Explains big data, data management, and data mining
This second edition of an established textbook, with new datasets, insights, excellent illustrations, and numerous examples with R, is perfect for senior undergraduate and first year graduate students in geography and the geosciences.
eBook