Catalogue Search | MBRL


Are you sure you want to remove the book from the shelf?

{{itemTitle}}
8
result(s) for
"Map drawing Technique."
Sort by:

The art of map illustration : a step-by-step artistic exploration of contemporary cartography and mapmaking
Embark on a unique artistic journey with The Art of Map Illustration! In this stunning book, visual storytellers, artists, and map enthusiasts alike will discover how to create a variety of bold, colorful, and lively maps using pen and ink, watercolor, mixed media, and digital art tools - step by step! Under the guidance and encouragement of four gifted map artists, aspiring mapmakers will learn how to work with the basic tools of the trade, as well as how to create distinctive maps of global points of interest, urban cities, quaint neighborhoods, and even the solar system. Artists will also learn how to use map art to evoke mood, communicate ideas, and express time and place. With dozens of tips, helpful techniques, and loads of inspiration, The Art of Map Illustration is the ultimate resource for contemporary artists seeking to learn the time-treasured art of cartography. -- back cover.
Book

REPRESENTATION OF SYNTHETIC SHADOWS ON 3D DIGITAL MODELS FOR THE VOLUMETRIC INTERPRETATION ON CONCAVE-CONVEX ARCHAEOLOGICAL ARTIFACTS
The representation of archaeological artefacts aims for the graphic description of relevant information from the object, to allow for the proper interpretation of evidences from the past. Concavities and convexities are elements often difficult to represent through classical (analogical) representation techniques, especially when these geometrical characteristics are neither continue nor parameterizable. Digital techniques have advanced on the accurate reconstruction of 3D shapes, while attaching real colour to the geometry. However, the perception of concave/convex shapes from photorealistic true-orthoimages continues to be limited, especially when rich and homogeneous textures camouflage slight slope changes or volumetric deformations. In this paper we first critically review the current practice on the representation of solid-of-revolution artefacts with concave-convex predominance, and alternative photorealistic representations aiming at a better understanding of volume and colour. Given the limitation targeted, we then propose a workflow for the creation of true-orthometric maps enhanced by customized shadows. The work-flow integrates considerations on: (i) The orientation of archaeological artefact; (ii) the creation of accurate orthometric images based on Digital photogrammetry techniques; and (iii) the application of synthetic attached and cast shadows according the shape (information) to be represented. The workflow is demonstrated with a sample of plates retrieved from the Rua-das-Madres archaeological site, in Portugal.
Journal Article

Remembering the Future
In a lucid style, Remembering the Future tracks the return of the indigenous Australian Warlpiri peoples to communities and their important collection of drawings, six decades after they were made. Discussions with many people, journeys to places, and archival research build a compelling account of the colonial and contemporary circumstances of Warlpiri lives. Crayon drawings collected by anthropologists provide an illuminating prism through which to explore how the Warlpiri people of central Australia have seen their place in the world and have been seen by others. Driven by speculative enquiry, this study is as much concerned with beguiling questions that remain unanswered and the limits of scholarship, as it is with what truths drawings might speak. Through these pictorial encounters substantial and fresh insights are generated into the crucial place of images in relationships between Warlpiri people and others. The result is a book that makes a significant contribution to the anthropology and history of central Australia, as well as the wider emergent field of visual studies.
eBook

Study on Three-Dimensional Design of Hydraulic Protection of Oil and Gas Pipeline Based on Database
The traditional method of design of hydraulic protection is completed by CAD software. The draft is drawn by hand in topographic map, profile map and column map. This design approach is inefficient and prone to error. In this paper, the three-dimensional design method of hydraulic protection is studied based on database. In the following, the key technologies are discussed, including the establishment of the knowledge model, database structures, quantities and the amount of material and three-dimensional modelling algorithm. Through practice applied in multiple projects, this kind of design method achieved good effect. the designers free themselves from the tedious work of drawing, calculations and statistical work of liberation. The efficiency and quality are greatly improved in using the digital design module.
Journal Article

Latin American Abstraction
This essay nuances the legibility of Joaquín Torres-García’s Inverted Map of South America as the supposed symbol of Latin America’s cultural independence. Rather than a transparent “illustration,” I argue that the Inverted Map traces an ambiguous routing of mestizaje constantly disavowed in the artist’s discourse while animating his visual praxis.
Journal Article
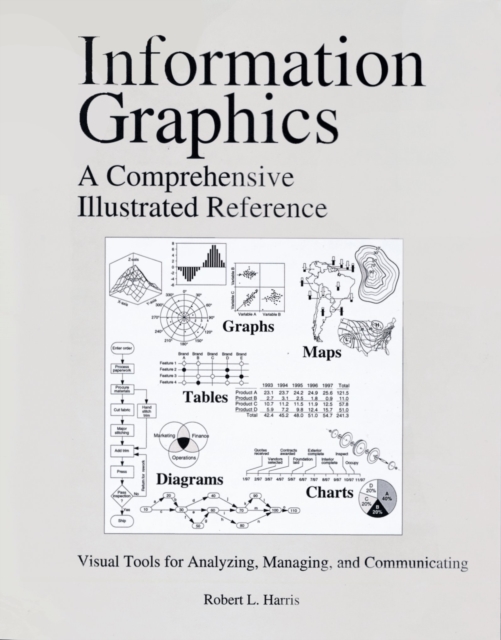
Information graphics : a comprehensive illustrated reference
This beautifully illustrated book is the first complete handbook to visual information. Well written, easy use, and carefully indexed, it describes the full range of charts, graphs, maps, diagrams, and tables used daily to manage, analyse, and communicate information. It features over 3,000 illustrations, making it an ideal source for ideas on how to present information. It is an invaluable tool for anyone who writes or designs reports, whether for scientific journals, annual reports, or magazines and newspapers.
eBook

Freehand Maps Are for Teachers and Students Alike
Freehand maps are recommended for illustrating geographic concepts. The chief advantage of freehand maps is that they can be used to highlight selected information in order to accomplish particular explanatory purposes. Freehand maps may be used productively by students as well as by teachers. With freehand maps, geographic concepts may be presented simply and directly, yet forcefully and clearly.
Journal Article
