Catalogue Search | MBRL


Are you sure you want to remove the book from the shelf?

{{itemTitle}}
1,202,874
result(s) for
"Temperature"
Sort by:


Analytical Model for the Higher Order Moments of Midlatitude Atmospheric Temperature Distributions
Observed distributions of atmospheric temperature are non‐Gaussian. Therefore, moments beyond variance are necessary in determining the frequency of extreme temperature events. Here we propose a simple kinematic model for atmospheric mid‐latitude temperature variability based on symmetric advection from a non‐symmetric background temperature profile. We then use this model to derive analytical expressions for the higher order moments of temperature distributions. Our results show that nonzero skewness and kurtosis arise due to the nonlinearity of the time‐mean meridional temperature profile. The analytical model matches an idealized Held‐Suarez atmospheric model, indicating nonlinearity of time‐mean temperature in latitude is the dominant contribution to nonzero skewness and kurtosis in synoptic temperature variations. Model analysis further shows decrease in higher order moments due to climate change come roughly equally from changes in mixing length and changes in the background temperature profiles. Plain Language Summary As climate change increases the average temperature of the Earth, the frequency and intensity of extreme temperature events changes as well. Understanding these changing extremes requires more than just understanding how the mean temperature increases; it requires an understanding of the entire distribution of daily temperatures and how this distribution changes. In this work, we build a theory for how the distribution of daily temperature is related to the time‐average temperature, and test this theory in a numerical climate model. We show that temperature changes in time at one fixed location are related to how the time‐mean temperature varies in space. Intuitively, this means we experience hot days when the air above us comes from a region where it is hotter on average, and we experience cold days when the air above us comes from a region where it is colder on average. Thus, we link a quantity that is important but difficult to measure—the frequency of temperature extremes—to a quantity that is well measured and more easily projectable into the future—the time‐average (or climatological) temperature profile. Key Points An analytical expression of the higher order moments of atmospheric temperature distributions is derived Latitudinal nonlinearity in temperature explains skew and kurtosis in mid‐latitudes for Held‐Suarez model with current temperature profile Changes in wind and temperature profiles equally contribute to decreases in moments due to climate change
Journal Article
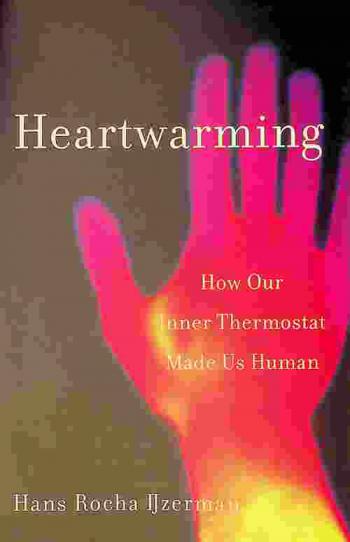
Heartwarming : how our inner thermostat made us human
\"A compelling investigation into the quest to maintain core body temperature-and how it drives genetic and social evolution, civilization, health, and technology. A cup of tea, coffee, or cocoa is calming and comforting-but why? Recent research suggests that temperature, even that derived from holding a hot beverage, can influence our emotions and behaviors. In Heartwarming, social psychologist Hans IJzerman explores temperature and its role in our daily lives through the long lens of evolution. Besides breathing, regulating body temperature is one of the most important tasks for any animal. Like huddling penguins, we humans have long relied each other to maintain our temperatures. Over millennia, this instinct for thermoregulation has driven our social lives. Understanding how temperature affects human sociality leads to fascinating new questions in our changing world: How will climate change impact society? Can thermoregulation keep relationships closer, even across distance? IJzerman offers new insights for therapists, doctors, sufferers of illnesses both mental and physical, and all of us who want to better understand our bodies and our connections. Heartwarming takes readers on a captivating journey through the world, seen from the perspective of coldness and warmth\"-- Provided by publisher.

An updated evaluation of the global mean land surface air temperature and surface temperature trends based on CLSAT and CMST
Past versions of global surface temperature (ST) datasets have been shown to have underestimated the recent warming trend over 1998–2012. This study uses a newly updated global land surface air temperature and a land and marine surface temperature dataset, referred to as China global land surface air temperature (C-LSAT) and China merged surface temperature (CMST), to estimate trends in the global mean ST (combining land surface air temperature and sea surface temperature anomalies) with the data uncertainties being taken into account. Comparing with existing datasets, the statistical significance of the global mean ST warming trend during the past century (1900–2017) remains unchanged, while the recent warming trend during the “hiatus” period (1998–012) increases obviously, which is statistically significant at 95% level when fitting uncertainty is considered as in previous studies (including IPCC AR5) and is significant at 90% level when both fitting and data uncertainties are considered. Our analysis shows that the global mean ST warming trends in this short period become closer among the newly developed global observational data (CMST), remotely sensed/Buoy network infilled datasets, and reanalysis data. Based on the new datasets, the warming trends of global mean land SAT as derived from C-LSAT 2.0 for the period of 1979–2019, 1951–2019, 1900–2019 and 1850–2019 were estimated to be 0.296, 0.219, 0.119 and 0.081 °C/decade, respectively. The warming trends of global mean ST as derived from CMST for the periods of 1998–2019, 1979–2019, 1951–2019 and 1900–2019 were estimated to be 0.195, 0.173, 0.145 and 0.091 °C/decade, respectively.
Journal Article

Measuring temperature
The temperature outside is always changing, which means getting an accurate read on it is important. This informative book shows readers how to measure temperature with a thermometer. Knowing the temperature will keep readers from diving into a freezing cold pool, or ensure they wear light clothes on a hot summer day. Showing measurements in both Fahrenheit and Celsius gives the book added value, and means readers will know the temperature no matter what kind of thermometer they use anywhere in the world.
Book

Spatial distribution of unidirectional trends in temperature and temperature extremes in Pakistan
Pakistan is one of the most vulnerable countries of the world to temperature extremes due to its predominant arid climate and geographic location in the fast temperature rising zone. Spatial distribution of the trends in annual and seasonal temperatures and temperature extremes over Pakistan has been assessed in this study. The gauge-based gridded daily temperature data of Berkeley Earth Surface Temperature (BEST) having a spatial resolution of 1° × 1° was used for the assessment of trends over the period 1960–2013 using modified Mann-Kendall test (MMK), which can discriminate the multi-decadal oscillatory variations from secular trends. The results show an increase in the annual average of daily maximum and minimum temperatures in 92 and 99% area of Pakistan respectively at 95% level of confidence. The annual temperature is increasing faster in southern high-temperature region compared to other parts of the country. The minimum temperature is rising faster (0.17–0.37 °C/decade) compared to maximum temperature (0.17–0.29 °C/decade) and therefore declination of diurnal temperature range (DTR) (− 0.15 to − 0.08 °C/decade) in some regions. The annual numbers of both hot and cold days are increasing in whole Pakistan except in the northern sub-Himalayan region. Heat waves are on the rise, especially in the hot Sindh plains and the Southern coastal region, while the cold waves are becoming lesser in the northern cold region. Obtained results contradict with the findings of previous studies on temperature trends, which indicate the need for reassessment of climatic trends in Pakistan using the MMK test to understand the anthropogenic impacts of climate change.
Journal Article

Temperature
\"Simple text and full-color photography introduce beginning readers to temperature. Developed by literacy experts for students in kindergarten through third grade\"-- Provided by publisher.
Book

The Berkeley Earth Land/Ocean Temperature Record
A global land–ocean temperature record has been created by combining the Berkeley Earth monthly land temperature field with spatially kriged version of the HadSST3 dataset. This combined product spans the period from 1850 to present and covers the majority of the Earth's surface: approximately 57 % in 1850, 75 % in 1880, 95 % in 1960, and 99.9 % by 2015. It includes average temperatures in 1∘×1∘ lat–long grid cells for each month when available. It provides a global mean temperature record quite similar to records from Hadley's HadCRUT4, NASA's GISTEMP, NOAA's GlobalTemp, and Cowtan and Way and provides a spatially complete and homogeneous temperature field. Two versions of the record are provided, treating areas with sea ice cover as either air temperature over sea ice or sea surface temperature under sea ice, the former being preferred for most applications. The choice of how to assess the temperature of areas with sea ice coverage has a notable impact on global anomalies over past decades due to rapid warming of air temperatures in the Arctic. Accounting for rapid warming of Arctic air suggests ∼ 0.1 ∘C additional global-average temperature rise since the 19th century than temperature series that do not capture the changes in the Arctic. Updated versions of this dataset will be presented each month at the Berkeley Earth website (http://berkeleyearth.org/data/, last access: November 2020), and a convenience copy of the version discussed in this paper has been archived and is freely available at https://doi.org/10.5281/zenodo.3634713 (Rohde and Hausfather, 2020).
Journal Article

Too hot? Too cold? : keeping body temperature just right
Explains how people and animals living in different parts of the world survive in hotter and colder climates using remarkable adaptive strategies and behaviors.
Book

Extreme Temperatures in the Antarctic
We present the first Antarctic-wide analysis of extreme near-surface air temperatures based on data collected up to the end of 2019 as part of the synoptic meteorological observing programs. We consider temperatures at 17 stations on the Antarctic continent and nearby sub-Antarctic islands. We examine the frequency distributions of temperatures and the highest and lowest individual temperatures observed. The variability and trends in the number of extreme temperatures were examined via the mean daily temperatures computed from the 0000, 0600, 1200, and 1800 UTC observations, with the thresholds for extreme warm and cold days taken as the 5th and 95th percentiles. The five stations examined from the Antarctic Peninsula region all experienced a statistically significant increase (p < 0.01) in the number of extreme high temperatures in the late-twentieth-century part of their records, although the number of extremes decreased in subsequent years. For the period after 1979 we investigate the synoptic background to the extreme events using ECMWF interim reanalysis (ERA-Interim) fields. The majority of record high temperatures were recorded after the passage of air masses over high orography, with the air being warmed by the foehn effect. At some stations in coastal East Antarctica the highest temperatures were recorded after air with a high potential temperature descended from the Antarctic plateau, resulting in an air mass 5°–7°C warmer than the maritime air. Record low temperatures at the Antarctic Peninsula stations were observed during winters with positive sea ice anomalies over the Bellingshausen and Weddell Seas.
Journal Article